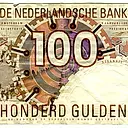
100 Gulden Biljet (1970-1992)
Related items — 17 listings · € 3,00–€ 141,90
Listings our filters keep out of the price — bundles, wrong versions, incomplete sets, parts, demos and other odd or interesting finds. Dig at your discretion.
Est. Total Market € 1.189,50
Moderate activity 121 listing changes in the last 30 days.
About this item
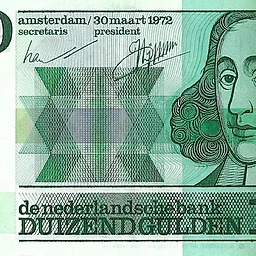
The 100 gulden biljet is one of the most iconic Dutch banknotes ever issued. The best-known version is the 1970-1992 series designed by R.D.E. Oxenaar, featuring a stylized snipe (watersnip) on the front. Earlier 100 gulden notes featured portraits of Admiral de Ruyter or Erasmus. These banknotes were the largest denomination most Dutch people ever handled in daily life, and they carry serious nostalgic weight in the Netherlands.
Dutch gulden banknotes became collectible the moment the euro replaced them in 2002. The 100 gulden — especially the Oxenaar-designed snipe note — is prized for its striking modernist design, which was considered groundbreaking for banknote art. De Nederlandsche Bank demonetized gulden notes in 2032 (they could be exchanged at face value until then), which adds a deadline dimension to collecting. Higher denominations naturally attract more collector interest.
When buying, condition is everything. Collectors grade banknotes from Poor to Uncirculated (UNC) — aim for Extremely Fine (XF) or better for investment-grade notes. Check for folds, creases, pin holes, stains, and tears. Serial numbers matter: low numbers, repeating patterns, or radar numbers (palindromes) command premiums. Verify the note series/year — the snipe design (1977-1992 dates) is most popular. Store in acid-free currency sleeves, never laminate.