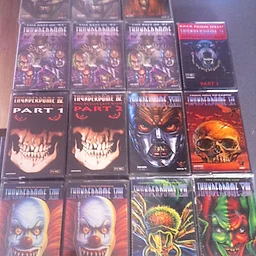
Thunderdome Flyer
Related items — 16 listings · € 4,00–€ 89,00
Listings our filters keep out of the price — bundles, wrong versions, incomplete sets, parts, demos and other odd or interesting finds. Dig at your discretion.
Est. Total Market € 160,00
Moderate activity 75 listing changes in the last 30 days.
About this item
Thunderdome flyers are the original promotional materials from the legendary hardcore/gabber event series that started in 1992 at the RAI in Amsterdam. These printed flyers — often A5 or A6 — featured dark, aggressive artwork and served as the physical invitations to what became the biggest hardcore techno events in the world. Each edition had its own unique design reflecting the escalating intensity of the scene.
For collectors of Dutch rave culture memorabilia, Thunderdome flyers are iconic artifacts. They capture a specific moment in music history when the Netherlands was the undisputed epicentre of hardcore techno. Early edition flyers (especially Thunderdome I through V) are the most valuable, as fewer survived — most ended up crumpled in jacket pockets or stuck on bedroom walls with tape.
Condition is critical with paper ephemera. Look for flyers without creases, tears, pin holes, or tape residue. Colours should be vibrant and unfaded. Watch out for reprints and reproductions that occasionally surface — original flyers have a print quality and paper stock that's hard to replicate exactly. Flyers from the first few editions in near-mint condition are genuinely scarce and highly prized in the gabber collector community.